Infographics have proven to be an effective visual tool for communicating to your target audience. You've used it over the past few years but do you think you've exploited its full potential?
What if we took it a step further? Blending the power of infographics and the gif trend, animated infographics can significantly improve your marketing impact, while leveraging your already existing creations.
Discover how you can recycle and transform your infographic archives to make them even more attractive an they surely already are.
The effectiveness of static infographics is already proven. But what if we focused on the one of animated infographics? What is their impact on your marketing ?
Now a multitude of formats can be published on your social networks: image, video, GIF... which expands your content offering.
Animated infographics are an adaptation of the image into video format, and then makes your static infographics more dynamic and impactful. And that's the whole effect you're looking for: to stand out in an increasingly competitive environment where social networks are teeming with information.
Then it's all about standing out.
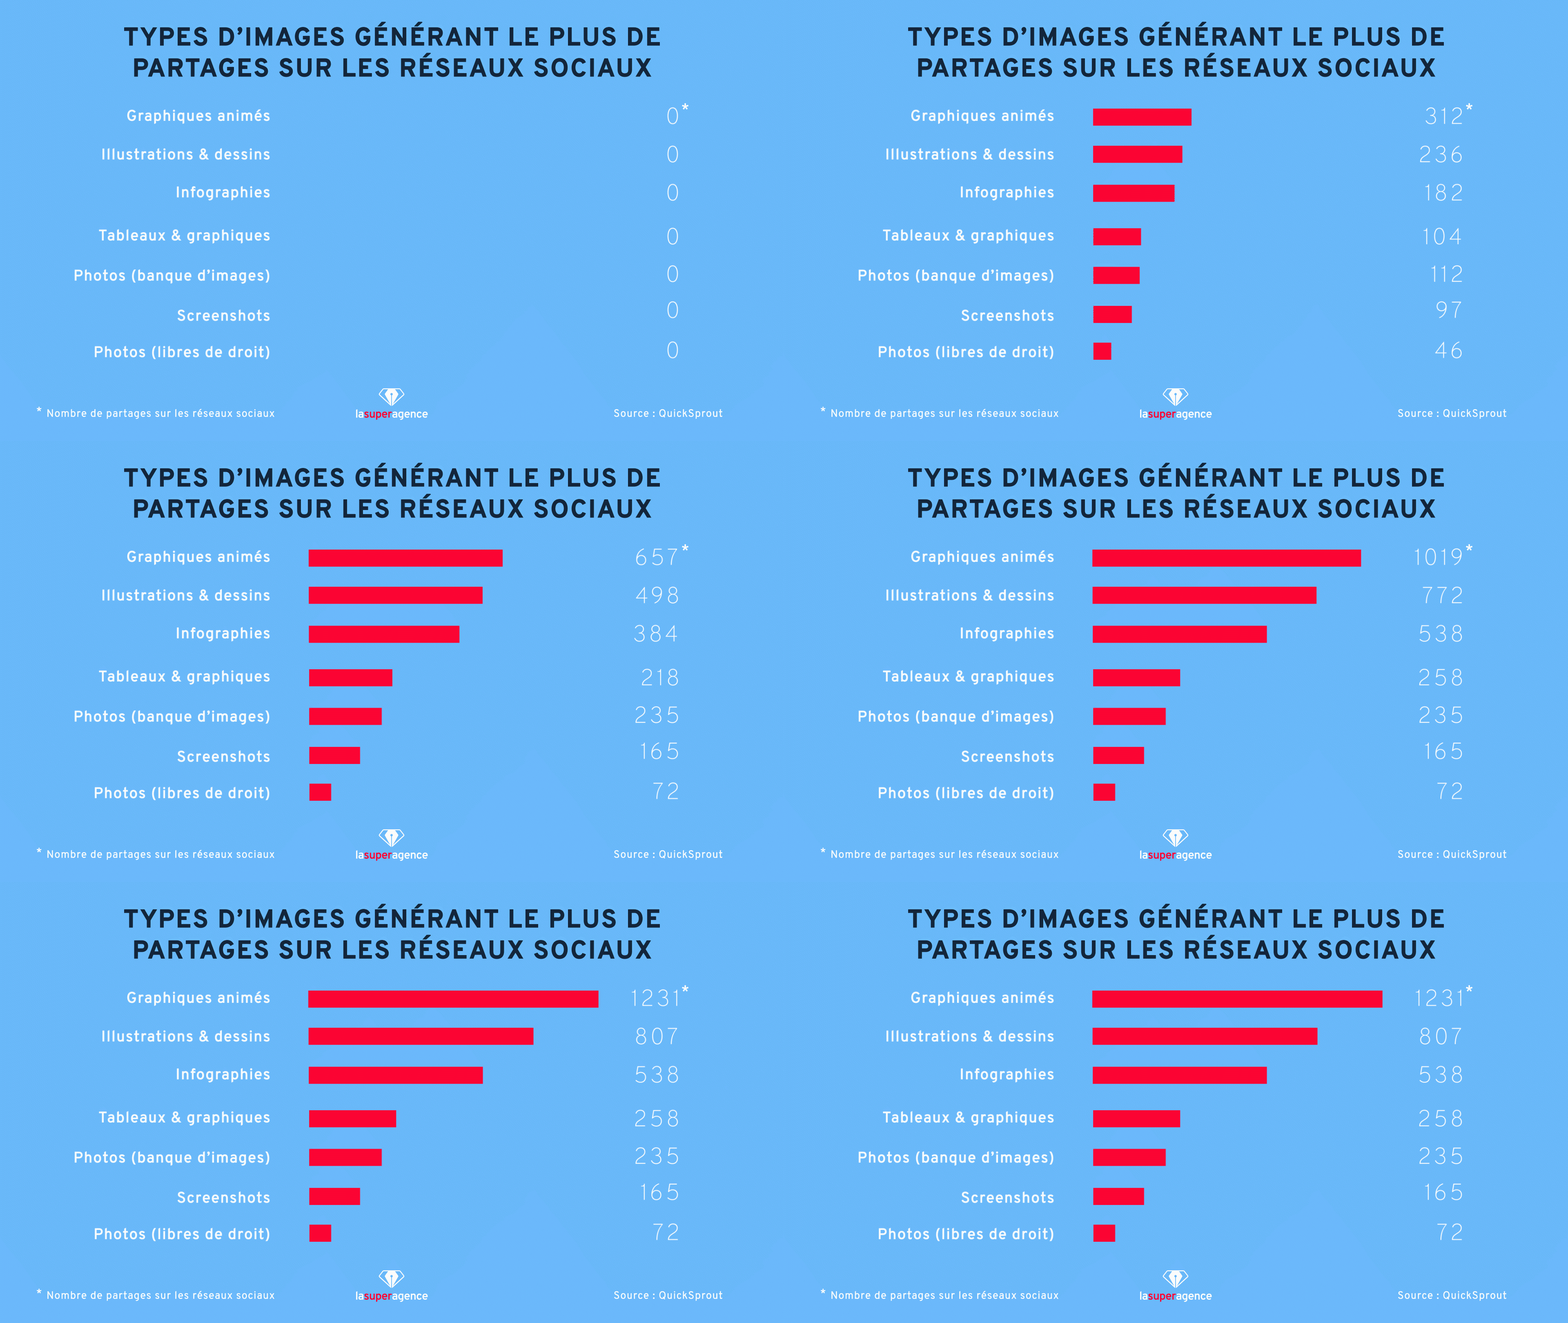
When QuickSprout, Neil Patel's site analyzed 41 blogs from different industries, we were able to find out which image format got the most shares on social networks. It then turns out that animated graphics are far ahead of the pack!"
 Animated infographics are shared more than other image formats
Used in blogposts, or in emails marketing, animated infographics allow you to increase your click-through rate n comparison to an email without an image or animation. Your content is then more pleasant to read, and most importantly, more accessible.
The classic infographic is meant to make a blog post more digestible.
Animated infographics now allow you to dynamize your static infographics. And dynamism doesn't just mean catching the viewer's eye. It also makes it easier to understand the message. The reader can then consume and synthesize the information in a short period of time.
The infographic then becomes interactive : your reader becomes spectator and actor. They can participate in your story by clicking, exploring and interacting with the content.
You can exploit your existing content to turn it into animated infographics. This then allows prolonging the lifespan of your numerous contents, giving them a second breath of modernity. You feed thus your various platforms with this new content, you dynamize the already existing content (like blog posts for example) and you personalize according to the target you want to reach.
To animate your infographics, first start by selecting one or two infographics that need to be updated in terms of their content for example, or that you want to modernize in form. So there's no need to start from scratch! Leverage your visual creations that have resources you can use.
Now, how do you animate your already existing content, and in what format ?
To guide you, here 4 ways to animate your infographics :
1 - The animated infographic
An animated infographic is simply an infographic with a animation.
You can use this type of animation to:
- tell a story
- present a theory in an educational manner
- explain key concepts
Think about decomposing the parts of the infographic to make them independent so you can add more content if needed. To train your graphic design teams you can offer them to work on internal projects that let their creativity run free.

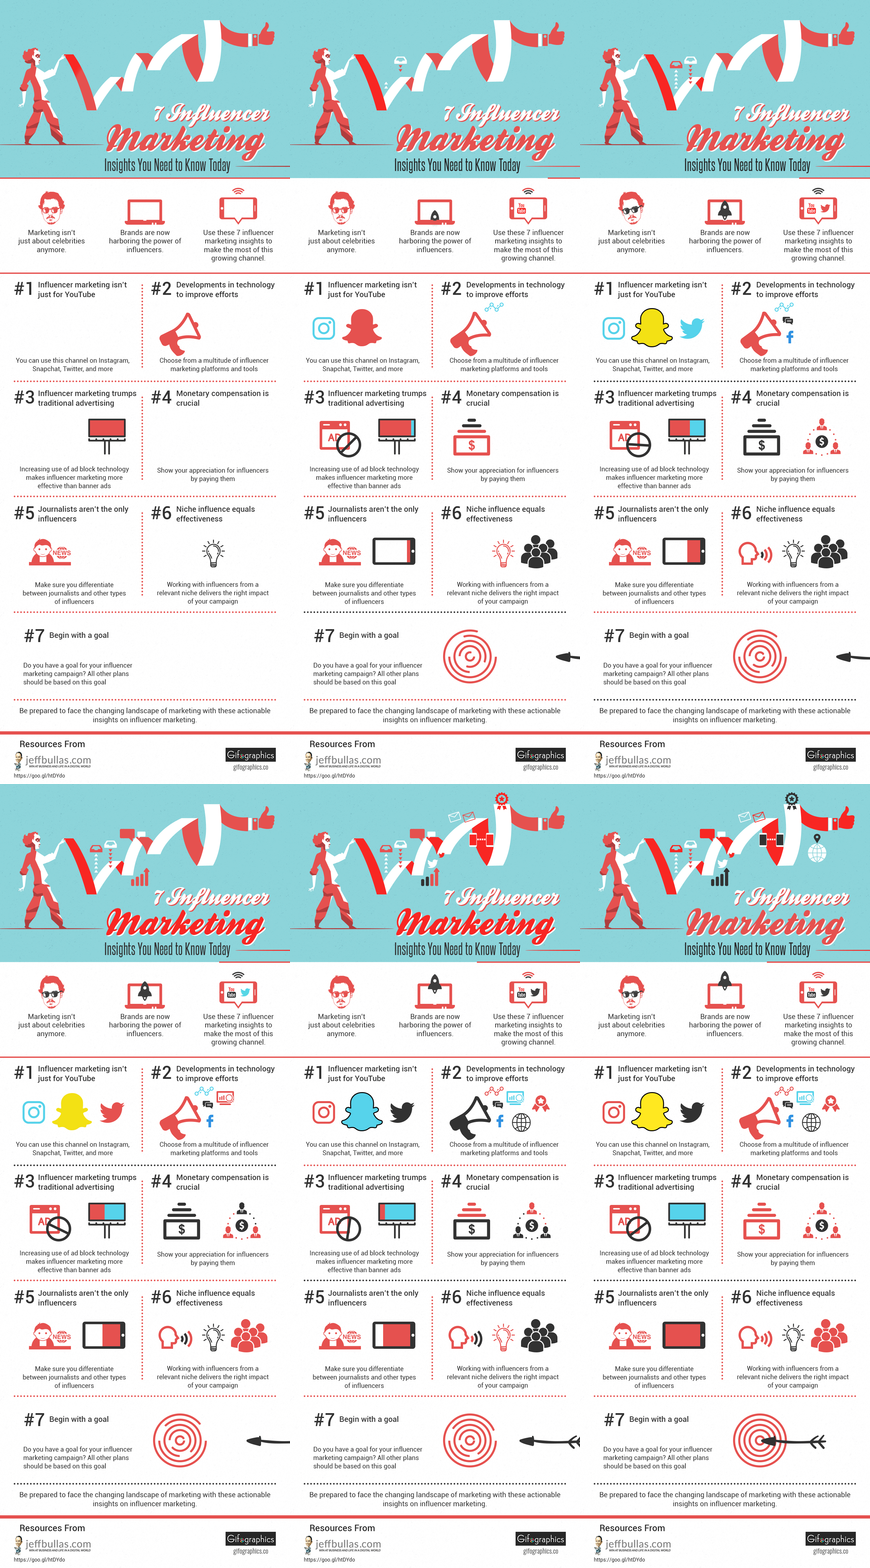
Animated infographics on 7 influencer marketing ideas, by Gifographics
2 -Gifographics
Technically, animated infographics are GIFs. But the GIFs we know are usually those looping images we see everywhere on the web. The reason they're shared so much on social networks and elsewhere is simply because they're funny and catchy. And if they are easy to consume they are just as easy to make!
You can use this type of animation to:
- share easily your content on social networks
- grab the attention of your audience
- highlight a key piece of information
You can use your existing infographics to extract elements and animate them individually, or you can extract only a portion of an infographic that you've already animated. Exploit anything that can move! If a key figure is more telling when it's animated, then don't hesitate any longer and take it to another level! You'll attract more reader attention.
Especially since this small format makes for great content for social networks, where GIFs and short, impactful content rule. This allows you to grab the reader's attention with parts of a piece of content to then direct them to more important content present on your blog.

Gif of infographics, presenting the presence of women in the different governments of the world
3 - Motion design animated graphics
Video content has proven itself in recent years. 80% of people would rather watch a video than read a blog post. Videos increase the engagement of viewers by 28%.
And for good reason, video is attractive, requires no effort on the part of the web user, makes it easier to understand the message and saves time.
That's why you can harness the power of motion design to convert your infographics into video animations, sometimes accompanied by audio for a multimedia project.
You can use motion design to:
- converting an explanatory infographic, highlighting data
- an tutorial
- explain a process
Length doesn't matter, you can just turn a short infographic into a 30-second graphic animation, which is more than enough to catch the reader's attention.
Motion design video from The Super Agency, How to measure the effectiveness of your recruitment process?
4 - The interactive infographic
This is the "Rolls" of animated computer graphics!
As the name suggests, interactive infographics allow the reader to interact with your content. In this way, you can tell him a story, taking him from one point to another. The point here is to guide the reader through the content to tell a story, or to offer additional content to explore.
Use your existing infographics to facilitate the creation of these new interactive infographics.
You can use this format to:
- make it easy to explore and understand large volumes of information and data
- tell a dense story while providing an immersive experience
- engage your targets
You can create an interactive infographic in a variety of ways. You can present a story and then let the reader explore the content themselves (by letting them change the slides for example), or let the reader explore on their own so they create and find their own story (for example a map of France, where the reader can click on the region they want and discover the data that interests them).
This type of infographic then allows you to offer the reader a personalized journey according to his or her interests. Thinglink for example, explains in an interactive infographic, the path taken during the primaries for the U.S. White House. A way to explain simply a journey that can sometimes be complex.
The advantages of these different infographic formats are multiple. In addition to engaging the reader to making him/her an actor and thus improving the user experience, you make your offer more understandable through a playful message.
This content can be part of a content marketing strategy linked to the Inbound Recruiting, to boost your infographics and blog content.
If you want to liven up your content and better engage your audience, just contact us !


